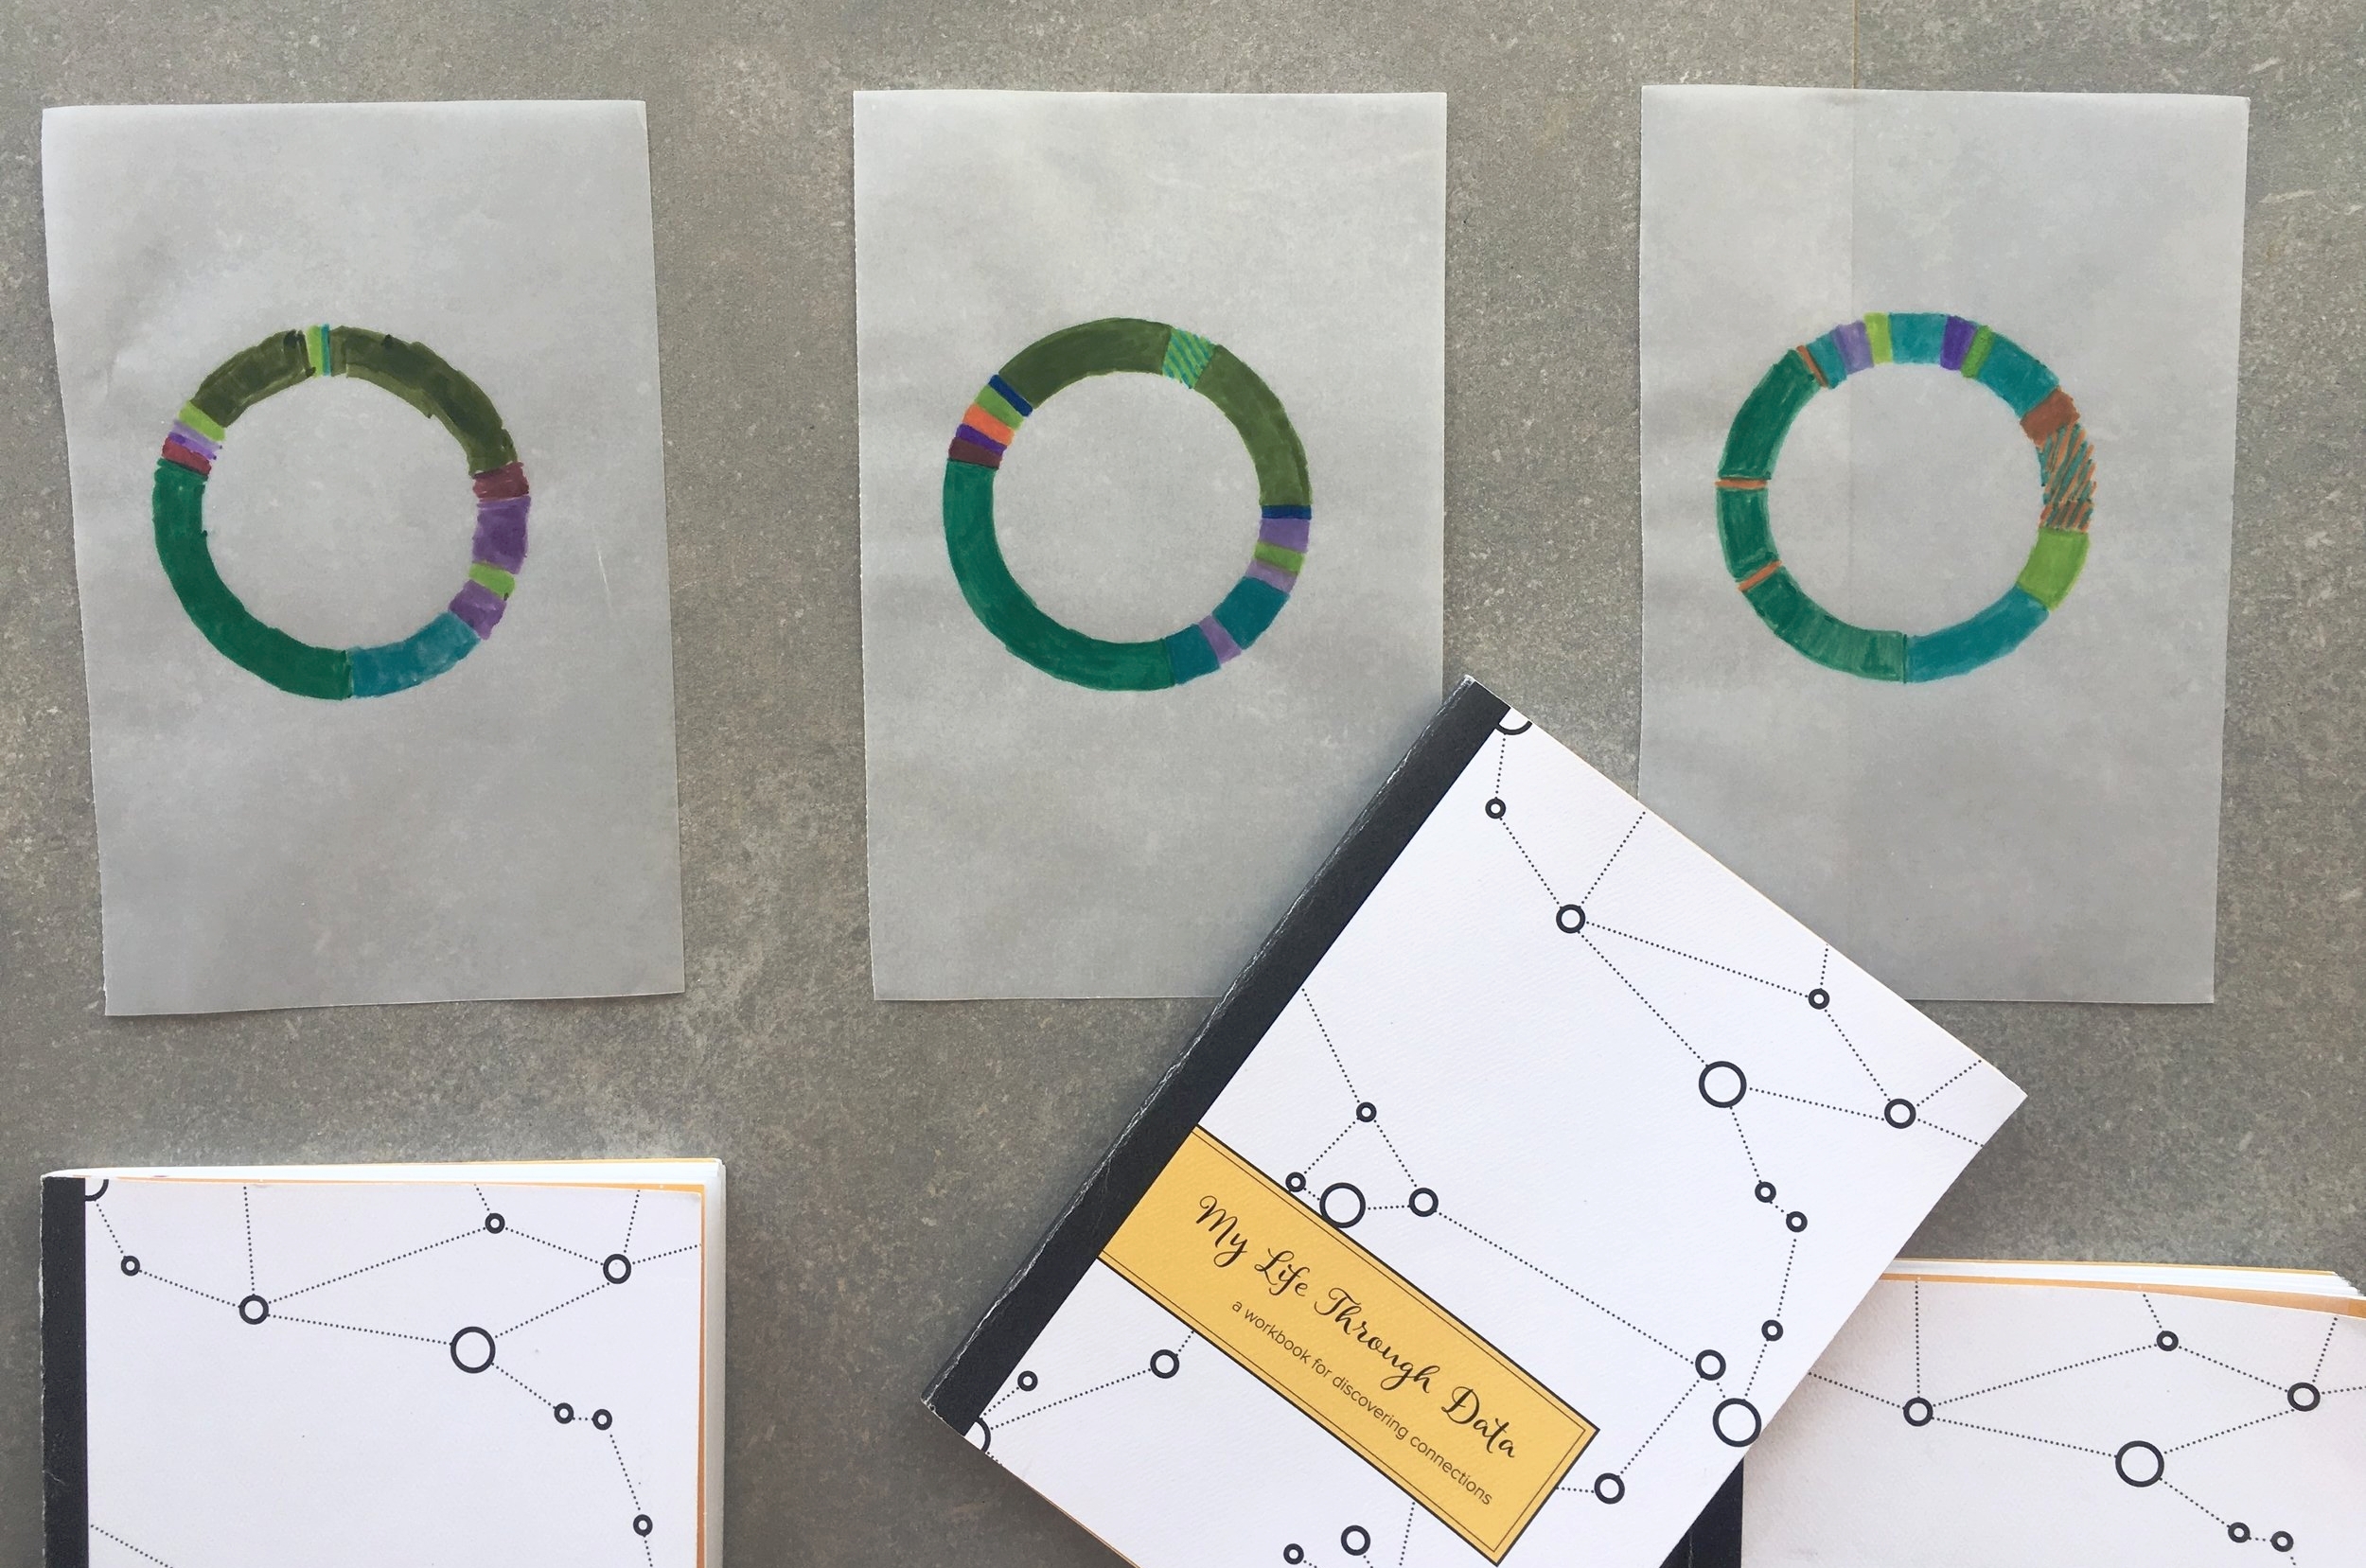
My Life Through Data is a physical interactive workbook of activities for people to track their daily habits, visualize them in a beautiful and unique way, then compare their lives to the American average.
- Date: 2016
- Role: Lead product designer, UX researcher, data analyst, project manager
- Stakeholders: MICA Information Visualization capstone project advisors
- Audience: While certainly accessible to a wider audience, the target consumer is an educated woman in her 20s or 30s. She generally knows who she is as a person, but might still be struggling to change or evolve herself.
- Problem: Connection is something we’re all searching for in our lives, and the activities in this data diary will help you record, visualize and find meaning in your patterns.
My Life Through Data is a physical interactive workbook of activities for people to track their daily habits, visualize them in a beautiful and unique way, then compare their lives to the American average. This project was submitted to satisfy the thesis requirement for my Master's in Information Visualization at MICA.
The book has semi-transparent vellum pages for activities that can be pulled out and placed over visualizations of relevant population distributions to facilitate different comparisons. This workbook is unique because it goes beyond just visualizing data; it gives personal information context by providing the ability to compare to an average or ideal. It’s also an enjoyable format that’s fun to fill out and creates unique pieces of data art.
This project was conceived as a fun, interesting and physical way for people to get more comfortable with themselves, visualizing data and their habits. It is inspired by recent “personal data” projects like Rachel Binx’s data jewelry project, Meshu, Dear Data, a book of personal data collection visualized as a postcard diary and the Pinterst sensation, bullet journals. While certainly accessible to a wider audience, the target consumer is an educated woman in her 20s or 30s. She generally knows who she is as a person, but might still be struggling to change or evolve herself. I envision the workbook as a tool for users to understand themselves and their relationships to others in a broader, data-driven context.
My life through data is a physical book. It is intended to be warm, human, tactile and fun. The book itself serves as a physical reminder of the users’ data and how their data makes sense in context that they can return to over time. The book is organized into sections: lifestyle & time, eating & drinking habits, and financial well-being. The more approachable sections at the beginning of the book consciously serve to introduce the user to the book’s methodology and ease them into the data gathering and comparison approach before they are asked to tackle their personal finances.
Data Quiz
Each of the sections has a quiz where the user mark their answers on semi-transparent vellum. The user then flips the page over to compare their responses to relevant scales or distributions within the broader American population.
Data Activity
Each section also includes an activity where the user tracks their data and creates a visualization of their habits. Some of these activities involve tracking data longitudinally to get a sense of how activities vary over the course of a day, week or month.
The user can then take that visualization and compare it to the average, to a friend’s response, to their own response at a different point in time or each piece can stand alone as beautiful data art.
This project was completed to satisfy the thesis requirements of my Master’s in Information Visualization from MICA in 2016. Since then, I also sent the book to a small group of peers for user testing, and it was well received by both my thesis examiners and user testers. It was featured on Andy Kirk's round-up of the best visualizations of February 2017. In the future, I plan to publish or Kickstart this book.


